Status Overview
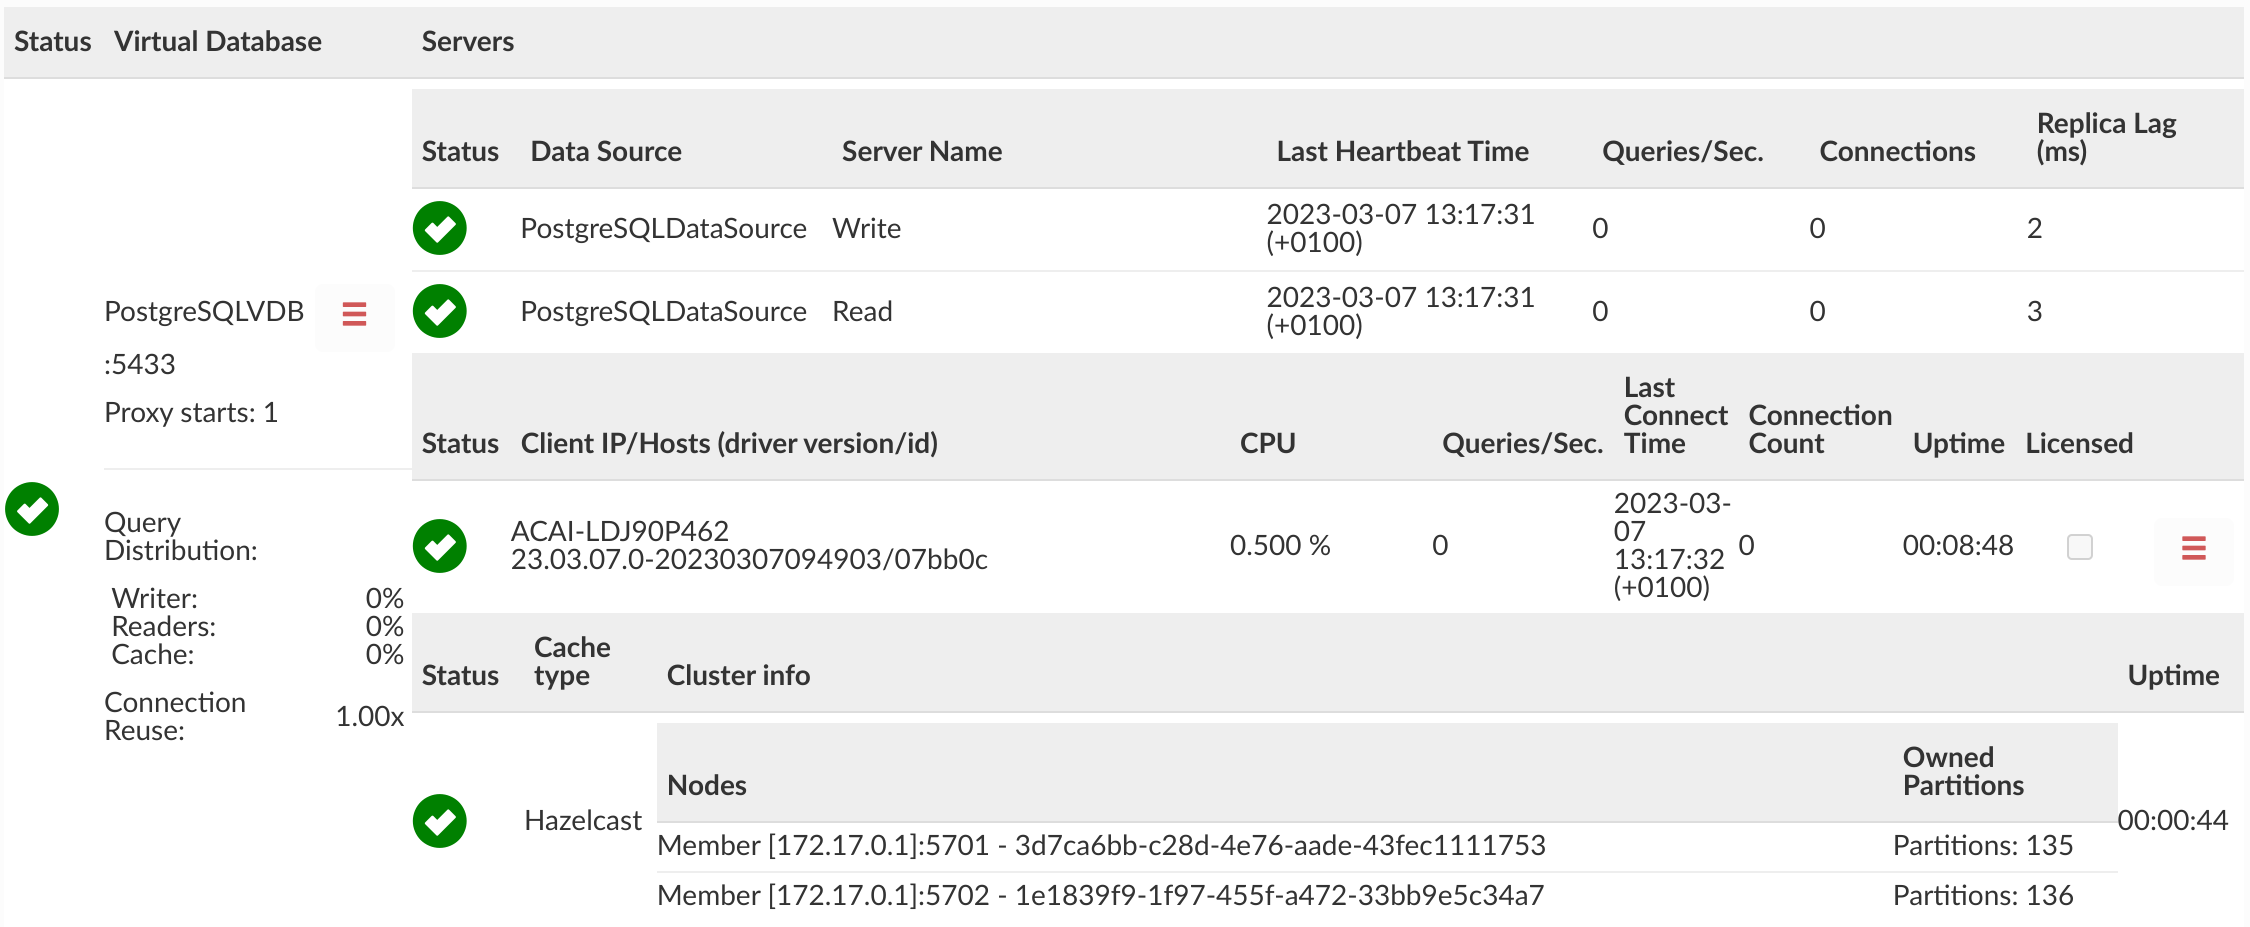
The status page provides a quick view of what VDBs are configured, what servers are attached to them, and their current health status, along with what clients are connected to them.
For each VDB, the data sources will be shown, the last HB time an update about that server was received, the current qps, connections and if configured, replica lag is.
For the clients, the pin option allows a given client to be saved and always viewed on the status dashboard. This is to allow the current state of clients that only periodically to be viewed. If the pinned option is not set, then clients not seen for over five minutes will disappear from the status view.
Note: A client MAY show as red if it is using connection pooling, despite traffic being active from the client.
If in the VDB configuration Cluster manager via cache is enabled and cluster cache has been used (i.e. Hazelcast or Redis working in cluster mode), the cluster information table will appear, showing cache type, status, list of nodes, partitions owned by each node and the cache uptime.
Note: The Hazelcast instance on the Heimdall Manager should not be responsible for owning any partitions; rather, all partitions ownership will given to the Heimdall proxy nodes.
All VDB Actions
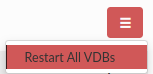
In the top-right corner, the collapsed menu button opens the additional actions menu:
- Restart All VDBs: Restart all proxy instances for all enabled VDBs.
VDB Actions
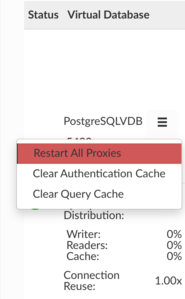
The collapsed menu button opens the additional actions menu:
- Restart All Proxies: Restart all proxy instances for the VDB.
- Clear Authentication Cache: Clear all authentication related Caches (users, passwords, AD groups etc.).
- Clear Query Cache: Clear Query Cache, if using a shared cache, this may clear all objects in the cache.
Proxy Actions
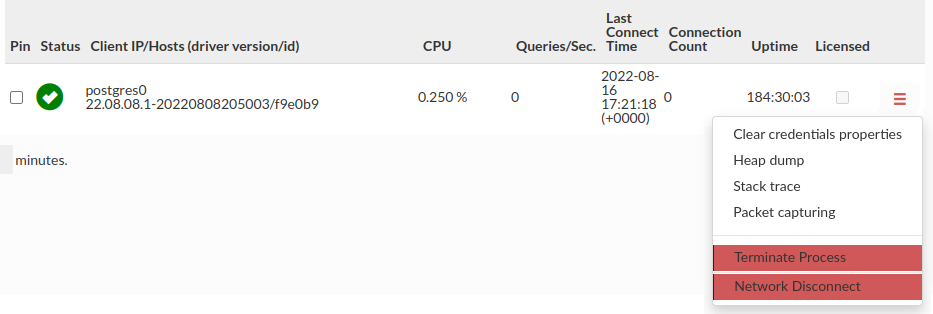
The collapsed menu button located on the right side of each client section opens the additional actions menu:
- Clear Credentials Properties: It will clear the credentials properties cache for a specific proxy. It's usefully when the SQL driven authentication is enabled.
- Heap dump: It will make a proxy heap dump, which will be available in Logs tab. You will need jmap to perform this action
- Stack trace: It will make a proxy stack trace, which will be available in Logs tab. You will need jstack to perform this action
- Packet Capturing: You can initiate a timed packet capture on specific Proxy nodes. This includes limiting duration, total number of files, and the size limit for the capture. Port 8087 and 8443 will be filtered out of the capture automatically.
- Terminate Process: It will terminate and restart proxy process - if the proxy is manged by central manager. Otherwise, if you have an independent proxy running, proxy process will be terminated (not restarted).
- Network Disconnect: It will disable the network interface of proxy simulating its unavailability. To enable proxy again turning the interface on manually and restarting the proxy is required. Superuser privileges required. Does not work on local proxies, as it's the same as central managers.
Note: When the Auto-Scaling Mode is enabled in Advanced Features and the VDB has multiple proxy nodes, then the Promote to active state option is available. With this option, it is possible to choose which node is active.
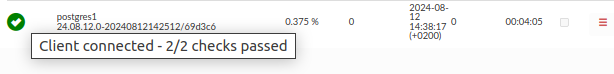
The status color for the proxy is handled by the double-check mechanism. This means that for the proxy to turn red, the last two checks must fail. This eliminates issues such as temporary network overload and prevents the proxy from flickering if the connection problem between the proxy and the central manager is only temporary. Hovering over the status ball will display this information.
Query Distribution
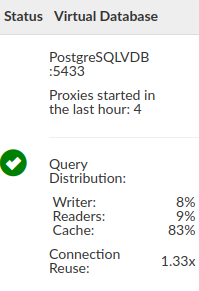
The Query Distribution part of VDB preview provides a quick view of some data aggregated during the proxy runtime. You need to enable certain options to view some of them.
-
Writer - percentage of all queries that did go to writer.
This statistic is enabled by default. -
Reader - percentage of all queries that did go to reader due Read/Write split.
To enable this statistic Read/Write Split must be enabled and configured properly. -
Cache - percentage of all queries that hit the cache.
To enable this statistic Caching must be enabled and configured properly. -
Connection Reuse - A ratio of how many connections were opened on the front vs on the back.
To enable this statistic connection pooling must be enabled and configured properly.
These statistics can be reset by restarting the proxy in the Status tab.
Fields on status tab:
Status and Virtual Databse
Status data is refreshed every 5 seconds.
-
Status - It's meaning is dependent on context - virtual database, server, client and cache - you can get more information when you hover your mouse over them. But overall meaning is:
- Green check - Ok - Working correctly
- Blue check - Standby
- Yellow warning - Warnings
- Red X - Failed
- Question mark - Status unknown
-
Virtual Database
- Vdb name - here we can see its name and port its working on.
- Proxy starts - we can see amount of proxy starts/restarts in last hour.
- Hamburger button icon see VDB actions
- Query Distribution - percentage of all queries that go to writer/reader or hit the cache, for more information see query section
Servers
Under this section we will see our data sources, clients/hosts and our distributed cache if it's used. At the end of our table there is Deployment Environment written.
-
Data source
- Status - See status section or hover over it for extra information.
- Data Source - It's the name of our datasource.
- Server Name - Either name of the datasource or server name if load balancing is used.
- Last Heartbeat Time - Last time when heartbeat was done.
- Queries/Sec. - Amount of queries per second calculated from last 5 seconds.
- Connections - Current connections amount for given server.
- Replica Lag (ms) - Requires Track replication lags in Data source / load balancing section. Tracks replication lag. - sign on status means not used. If it is -1 or 0 in jmx it is not used.
-
Client/Hosts
- Status - See above and hover over it for extra information.
- Client IP/Hosts (driver version/id) - Ip or hostname followed by driver version with first 6 signs of driver id.
- CPU - Current usage of cpu in %.
- Queries/Sec. - Amount of queries per second calculated from last 5 seconds.
- Last Connect Time - Last time our host was on. Useful when we want to see when our host went off.
- Connection Count - Current connection count to our host.
- Average Connection Lifetime[s] - Five minutes rolling average of each minute average open connections lifetime between client's app and heimdall (in seconds). It means that in each minute, we take all active connections and calculate the average for them. Only last five minutes snapshots are taken to calculate the roll average. Highlighted in red if greater than 300 seconds.
- Uptime - How long the proxy is running since last started/restarted.
- Licensed - Is the proxy or driver running on licensed marketplace instance.
-
Distributed cache - shown only if used.
- Status - See above and hover over it for extra information.
- Cache type - Below we can see name of used cache. E.g. hazelcast.
- Cluster info
- Nodes Information about node usually address with uuid.
- Owned Partitions amount of owned partitions.
- Uptime - How long the cache is running since last started/restarted.
How to get status tab information from JMX
This section shows how you can get status tab data from JMX - more information about setting it up and getting information can be found here.
⚠️ Note: Statistics in JMX are sometimes calculated differently, they differ in refresh rate and will be reset on any configurations changes or proxy restarts.
Why some data may differentiate over time?
Jmx usually shows data from the start - since last restart or configuration changes - it allows to get whole set of data.
Status tab shows data that is time sliced - Old data is removed after certain period of time - that allows us to focus on current data and trends. Time slicing make it easier to analyze trends and detect anomalies.
We can get the statistics per seconds / minutes etc. that is not time sliced from jmx:
We can get our client's uptime (in ms):
/heimdall-management/JVMUptime and divide it by 1000 to get uptime in seconds.
We can use it to get any data per any unit of time. For example: We can divide TotalQueries / uptime in seconds to get Queries/Sec which will not be time sliced. It can be used to get any data per seconds / minutes / hours.
Status tab information and its equivalent from JMX
Http: Every call starts with http://{healthcheck-host}:{healthcheck-port}/jmx then we add from documentation our rest of the path.
For example if healthcheck host is localhost, and healthcheck port is configured to 8070 in VDB Advanced features:
http://localhost:8070/jmx
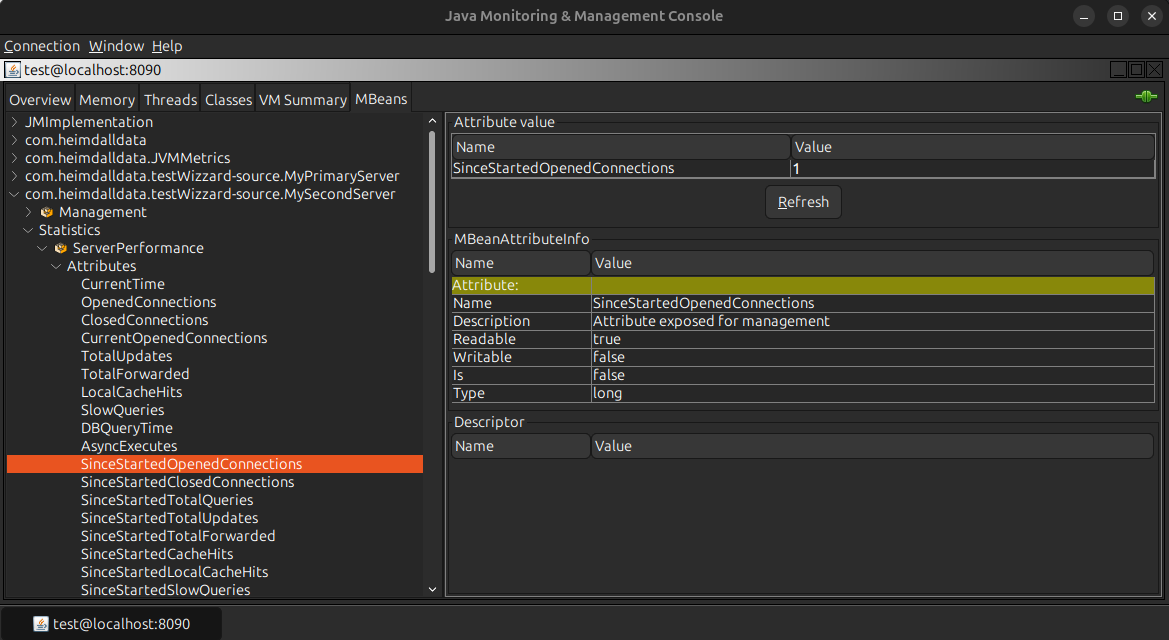
JMX: Every call is composed of: {domain}:type={component}[,name={instance}] {attribute}
For example:
        com.heimdalldata.testWizzard-source.MySecondServer:type=Statistics,name=ServerPerformance SinceStartedOpenedConnections
         ------------------------------------------------       -----------     -----------------     -------------------
                             DOMAIN                              COMPONENT          INSTANCE                ATTRIBUTE
Documentation starts with component E.g. [ Statistics ] followed by instance (if needed) and attribute, so without the domain - for better visibility and less clutter.
In jconsole it is seen as:
Calculating status data
-
Proxy starts - We can't get this data from jmx as our jmx statistics resets with proxy restarts and configuration changes.
-
Query Distribution: On status tab it shows latest usage - that means old statistics are eventually deleted and not counted at all, for more read time sliced data. Here we can get whole data from the start:
- Writer
- Http: /heimdall-management/SinceStartedWriterQueryPercent
- JMX: Management SinceStartedWriterQueryPercent
- Readers
- Http: /heimdall-management/SinceStartedReaderQueryPercent
- JMX: Management SinceStartedReaderQueryPercent
- Cache
- Http: /heimdall-management/SinceStartedCacheQueryPercent
- JMX: Management SinceStartedCacheQueryPercent
- Connection Reuse used with connection pooling - can be calculated as number of Total made connections / Created connections.
HTTP:
/heimdall-management/ProxyConnections
divided by:
/connection-pool/Created

JMX:
Management ProxyConnections
divided by:
ConnectionPoolStatistics Created
- Writer
SERVER
Single data source (Load Balancing disabled)
Example domain for JMX without Load balancing: com.heimdalldata.testWizard-source.testWizard-source
When we don't use load balancing it will default to: com.heimdalldata.
⚠️ Note: In a single data source environment, some statistics may not be meaningful. For example, the currentLag will always show 0.
Multiple servers for data source (Load Balancing enabled)
Example domain for JMX with Load balancing: com.heimdalldata.testWizard-source.MyPrimaryServer
testWizzard-source is the name of our data source
While MyPrimaryServer is the name of the server from Load Balancing/High Availability section in data sources tab.
This data is per server while load balancing option is enabled.
- Last Heartbeat Time - either in ms or in year-month-day hours-minutes-seconds (timezone) (yyyy-MM-dd HH:mm:ss (Z)) format so as can be seen in status tab:
- Http:
- Status tab format: /server-stats/LastHeartbeatTimeAsDate
- Milliseconds: /server-stats/LastHeartbeatTime
- JMX:
- Status tab format: Statistics,name=ServerPerformance LastHeartbeatTimeAsDate
- Milliseconds: Statistics,name=ServerPerformance LastHeartbeatTime
- Http:
- Queries/Sec. - On jmx we can get this statistic, but it will differentiate over time, for more information see time sliced data
- We can get total Queries and then divide them by uptime:
- Http: /server-stats/SinceStartedTotalQueries
- JMX: Statistics,name=ServerPerformance SinceStartedTotalQueries
- We can get total Queries and then divide them by uptime:
If we want Queries per second we can get our client uptime (in ms): /heimdall-management/JVMUptime and divide it by 1000 to get uptime in seconds. Then we can divide TotalQueries / uptime (in seconds) to get Queries/Sec.
⚠️ Note: This will be total Queries/Sec. which will not match our status statistic.
-
Connections - these are connection per server like shown on status
- Http: /server-stats/CurrentOpenedConnections
- JMX: Statistics,name=ServerPerformance CurrentOpenedConnections
-
Replica Lag (ms) If the current lag is showing -1 or 0 (jmx) or - (status tab) it is not used.
- Http: /server-stats/CurrentLag
- JMX: Statistics,name=ServerPerformance CurrentLag
CLIENT
-
CPU
- Http: /heimdall-management/CpuLoad
- JMX: Management CpuLoad
-
Queries/Sec. Data will differentiate over time. For more information see time sliced data:
Http:
/heimdall-management/ProxyQueryCount
divided by:
( /heimdall-management/JVMUptime / 1000 )

JMX:
Management ProxyQueryCount
divided by:
( Management JVMUptime / 1000 )

Simply: Queries / (uptime / 1000)
⚠️ Note: This will be total Queries/Sec. which will not match our status statistic.
-
Last Connect Time
- Http:
- Status tab format: /heimdall-management/LastConnectTimeAsDate
- Milliseconds: /heimdall-management/LastConnectTime
- JMX:
- Status tab format: Management LastConnectTimeAsDate
- Milliseconds: Management LastConnectTime
- Http:
-
Connection Count
- Http: /heimdall-management/CurrentClientOpenedConnections
- JMX: Management CurrentClientOpenedConnections
-
Average Connection Lifetime [s]
- Http: /heimdall-management/ClientOpenConnectionLifetimeAverage
- JMX: Management ClientOpenConnectionLifetimeAverage
-
Uptime either in ms or in Hours-minutes-seconds (HH:mm:ss) format so as can be seen in status tab:
- Http:
- Status tab format: heimdall-management/UptimeInHours
- Milliseconds: /heimdall-management/JVMUptime
- JMX:
- Status tab format: Management UptimeInHours
- Milliseconds: Management JVMUptime
- Http: